Credit Score Education
 Credit Reporting & Consumer Rights
 Personal Finance Tips
 Budgeting & Money Management
 Identity Theft & Fraud Prevention
 Credit Card Education
 Consumer Financial News
 Cost of Living & Inflation
 Banking & Savings Education
 Consumer Protection & Financial Literacy

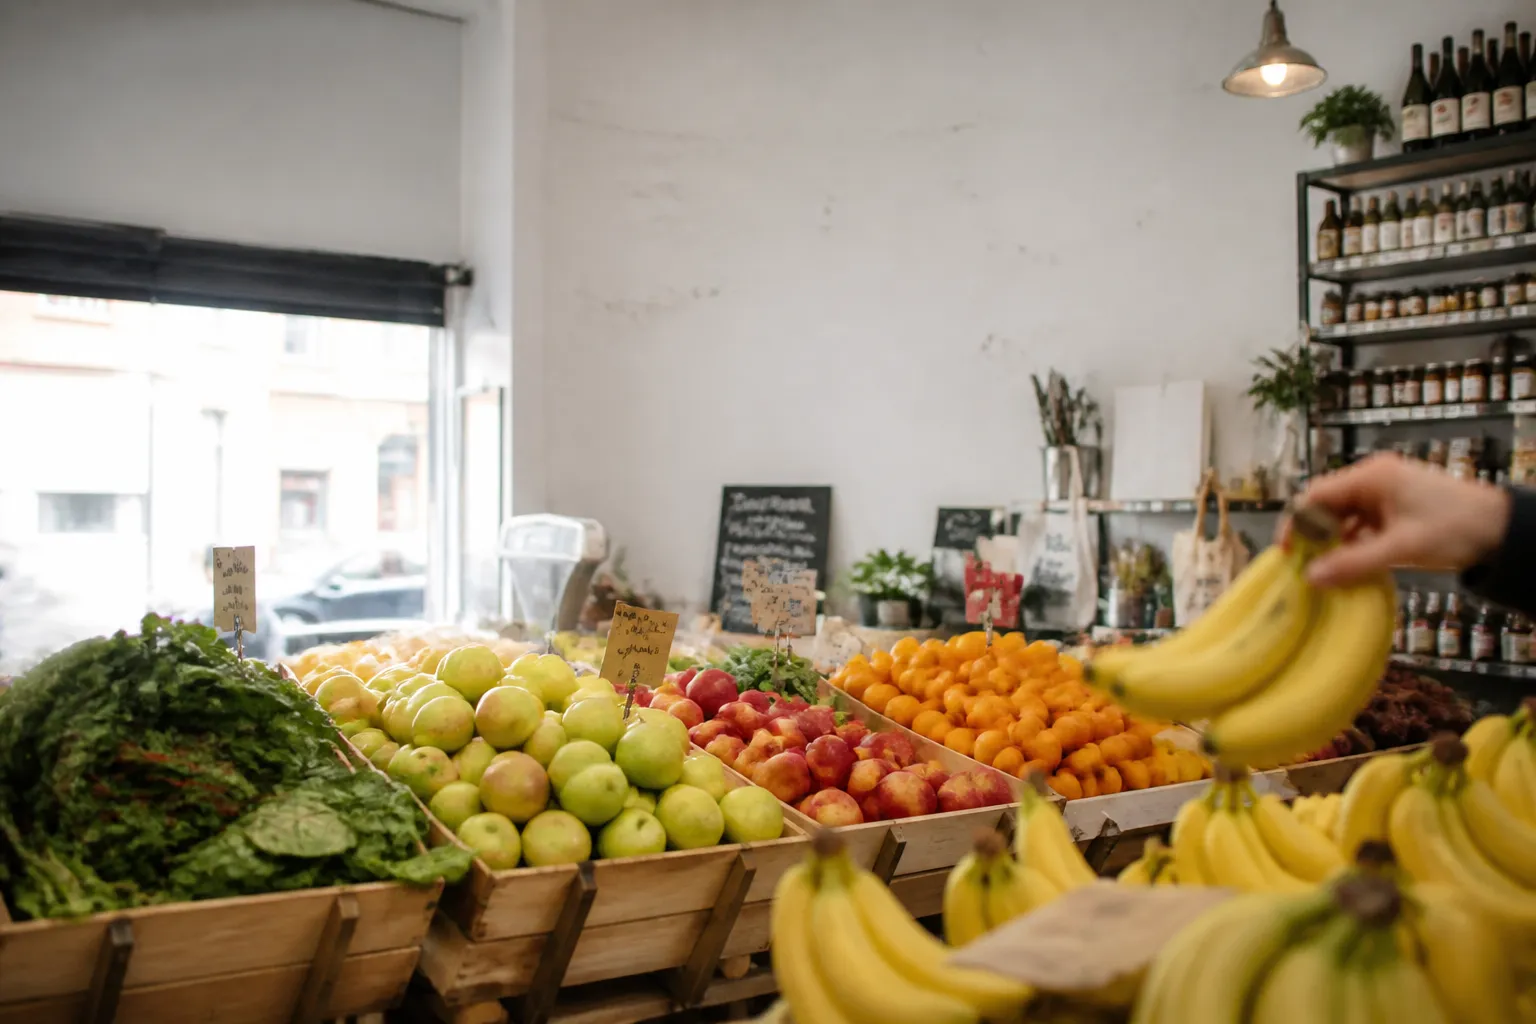
Tracking how grocery prices change across multiple years requires a clear baseline and reliable public data. Rather than relying on store receipts from different seasons or subjective impressions at the checkout aisle, consumers can turn to official index series compiled by federal statistical agencies to see how grocery costs have shifted over time.
- Locate the official index: Find the monthly values for the Consumer Price Index for food at home, which tracks what retail shoppers pay for groceries across the country.
- Pick consistent benchmark months: Choose the same calendar month for each comparison year, such as September to September, to prevent seasonal price spikes from altering your calculation.

- Calculate the percentage change: Subtract the older index number from the newer index number, divide that difference by the older number, and multiply by 100.
- Verify the adjustment basis: Confirm that both numbers use the same reporting basis, ensuring you do not accidentally compare seasonally adjusted numbers against unadjusted reports.
Start with the right index
To measure grocery inflation accurately, you need a data series that isolates food purchased for off-premises consumption from other household expenses. The principal benchmark for this is the Consumer Price Index for food at home for the U.S. city average, published monthly by the Bureau of Labor Statistics. This index measures retail prices paid directly by consumers in supermarkets and grocery stores. It is constructed on a 1982-1984 reference base equal to 100, meaning that every published monthly number reflects how far prices have climbed relative to that historical baseline.
Public access to these monthly figures is straightforward. The Federal Reserve Bank of St. Louis maintains this series online through its FRED economic data platform, where anyone can examine historical levels and review upcoming release dates. Keeping to this single benchmark ensures that your numbers remain consistent from year to year. For example, the seasonally adjusted food-at-home index registered at 320.836 in May 2026, moved to 321.446 in June, sat at 321.216 in July, reached 321.335 in August, and stood at 321.111 in September 2026.
It is equally important not to confuse retail figures with wholesale data. The Bureau of Labor Statistics and the U.S. Department of Agriculture also report on producer prices. As outlined by the USDA Economic Research Service, the producer price index for food tracks the prices received by domestic agricultural producers and food manufacturers, not what shoppers pay at retail checkouts. Because wholesale prices incorporate different shipping, processing, and commodity pressures, using producer data as a proxy for consumer grocery expenses will distort your multi-year comparison.
Calculate the percent change between two dates
Once you have selected the appropriate food-at-home index series, measuring price movement across several years comes down to a standard mathematical formula. The method is described in detail through the Bureau of Labor Statistics guide on calculating percent changes. First, record the index value for your earlier date. Next, find the value for your target date. Subtract the earlier number from the later number, divide that result by the earlier number, and multiply by 100. The resulting figure represents the exact percentage increase or decrease over that specific period.
For multi-year comparisons, year-over-year measurements provide the most reliable perspective. Evaluating prices from September of one year to September of the next helps minimize normal seasonal swings that affect produce, meats, and dairy throughout the calendar year. According to findings published by the Economic Research Service Food Price Outlook, food-at-home prices rose 1.8 percent between September 2025 and September 2026. Over that identical period, the broader all-items index rose by 3.7 percent, demonstrating that grocery costs grew at a slower pace than the overall basket of consumer expenses.
If you want to track costs across three, four, or five years, you can apply this calculation directly across the full window, comparing your earliest baseline month directly to your most recent month. Alternatively, you can calculate each twelve-month increment individually. The annual breakdown shows whether price movement accelerated or leveled off along the way, while the multi-year calculation reveals the cumulative shift in price levels over the full span.
Avoid common mistakes in multi-year comparisons
One frequent error when analyzing price records is mixing seasonally adjusted data with figures that are not seasonally adjusted. Statistical agencies apply seasonal adjustments to smooth out predictable annual patterns, such as weather variations or holiday demand. However, unadjusted tables show raw, collected prices. If you take a seasonally adjusted number from one database and compare it to an unadjusted rate from another report, your comparison will be skewed.
This distinction explains why official reports can appear to show conflicting short-term figures while remaining factually accurate within their respective methodologies. In the FRED database, the seasonally adjusted food-at-home index dipped slightly from 321.335 in August 2026 to 321.111 in September 2026. Meanwhile, the summary tables from the Economic Research Service recorded a 0.1 percent monthly uptick for food at home over that same month, because their summary figures were not seasonally adjusted. Neither number is wrong, but combining the two in a single multi-year equation creates an inaccurate result.
Another common mistake is treating the overall Consumer Price Index as a direct mirror of your grocery receipt. The headline all-items CPI covers a comprehensive market basket of goods and services, including shelter, transportation, medical care, and apparel. Food at home represents only one portion of that broader measurement. Because grocery prices often follow independent supply constraints, comparing overall inflation to personal supermarket bills gives a misleading view of how food expenses actually behaved.
Know what the index cannot tell you
Official price indexes provide a reliable snapshot of broad retail trends across urban areas, but they cannot capture every individual circumstance. The national food-at-home index reflects the spending habits of an aggregate population across diverse regions. It does not reflect the exact register totals of a specific household. Individual expenses depend on the specific cuts of meat, brands, package sizes, and regional discount stores a family selects each week.
Federal statistical programs do not publish customized formulas that convert broad consumer indexes into personalized household budgets. Those seeking additional context about methodology often consult the Bureau of Labor Statistics on CPI frequently asked questions to understand how representative baskets are sampled. If you want to measure your own personal inflation rate accurately, you need to track your personal grocery receipts over several years and compare your own historical category expenditures alongside federal benchmarks.
Data revisions are another operational detail to keep in mind when documenting multi-year records. Agencies may refine seasonal adjustment factors or update baseline series as updated market information arrives. When recording benchmark index values for your household financial records, note the exact table name, the publication date, and the web source where you retrieved the information. If you notice discrepancies in broader consumer financial issues or suspect unfair retail billing practices, regulatory agencies such as the Federal Trade Commission or the Consumer Financial Protection Bureau provide official educational materials and formal complaint systems to help consumers navigate their rights.
Read the most recent data carefully
Keeping an eye on current releases provides vital context for any long-term grocery comparison. In the data released for September 2026, the Economic Research Service reported that overall food prices, which combine food at home with food away from home, were 2.5 percent higher than in September 2025. While grocery store prices increased by 1.8 percent over those twelve months, restaurant and takeout prices rose by 3.5 percent. This difference shows that dining out pushed food inflation upward more aggressively than supermarket shopping during that cycle.
Examining rolling twelve-month comparisons alongside month-to-month observations helps separate short-term price spikes from long-term trends. A single month of rising egg or citrus prices may generate dramatic headlines, but multi-year comparisons show whether those increases persisted or quickly reversed. Looking at extended data published through the USDA Food Price Outlook program, which monitors monthly Bureau of Labor Statistics reports and models annual food price changes up to 18 months ahead, can help consumers anticipate general grocery trends without relying on guesswork.
Whenever you construct a multi-year comparison, clarity depends on keeping your data sources straight. Use the food-at-home CPI for retail grocery questions, reserve the producer price index for wholesale supply considerations, and stick to consistent calendar months across every year you examine. By relying on official federal data and straightforward percentage formulas, you can establish an objective, verifiable record of how grocery costs have evolved over time.
Please seek a professional. This article is general information, not financial, tax or insurance advice. Please seek a licensed financial, tax or insurance professional about your own situation.