 Credit Score Education
 Credit Reporting & Consumer Rights
 Personal Finance Tips
 Budgeting & Money Management
 Identity Theft & Fraud Prevention
 Credit Card Education
 Consumer Financial News
 Cost of Living & Inflation
 Banking & Savings Education
 Consumer Protection & Financial Literacy

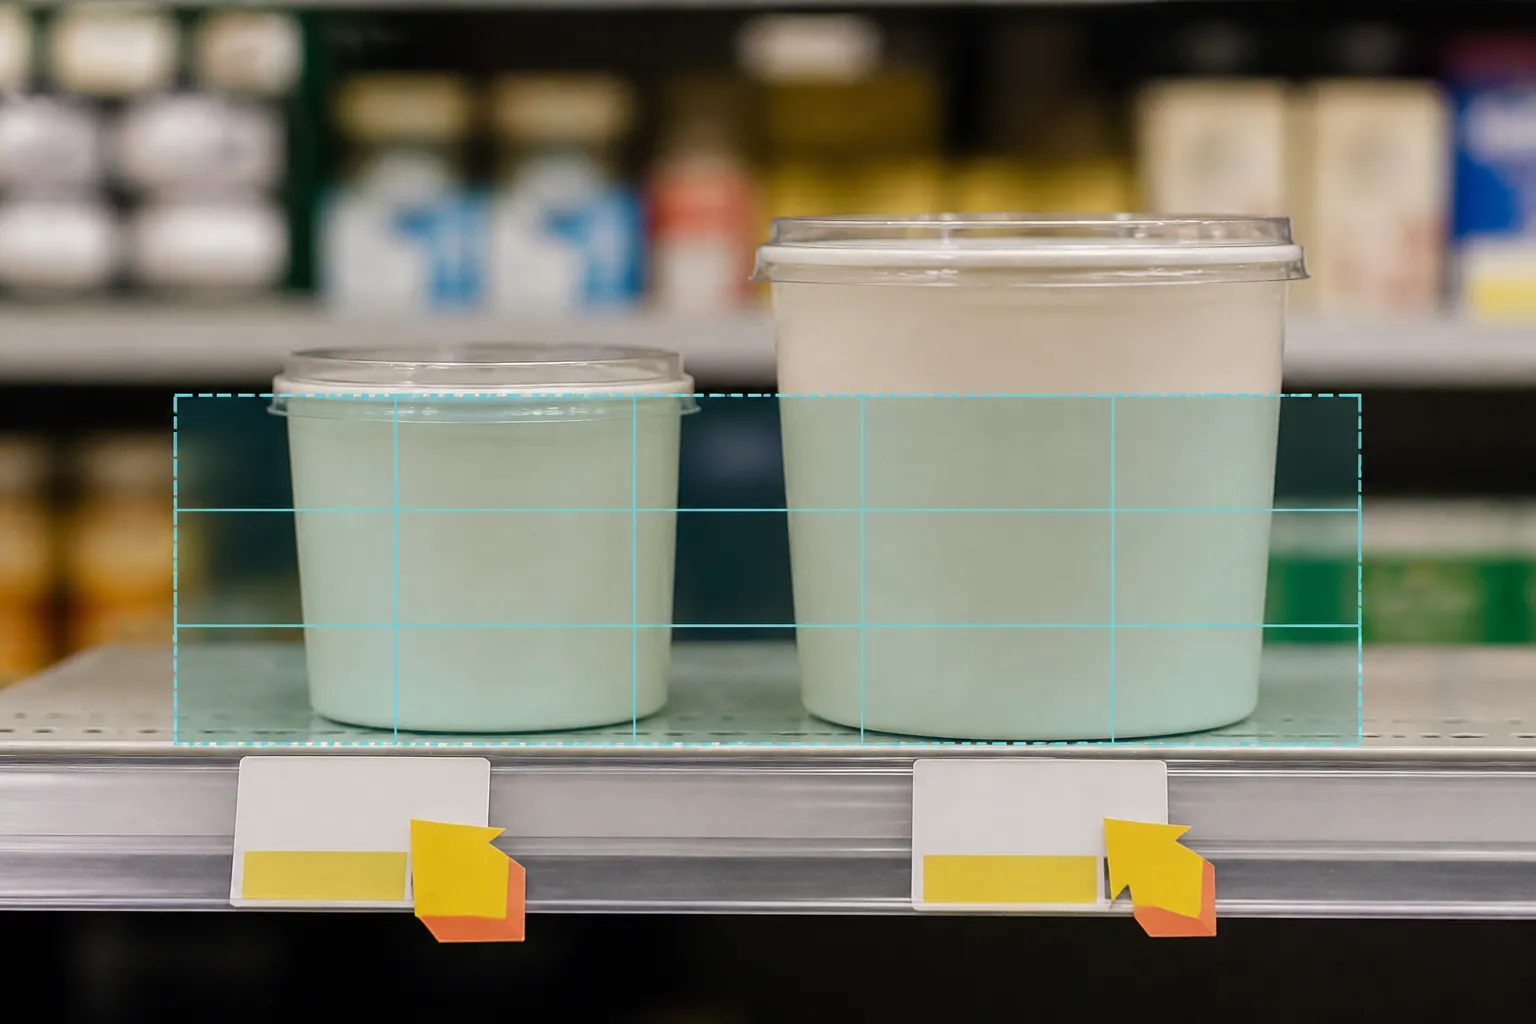
A walk down the supermarket aisle often presents a wall of numbers that disguise actual costs. A twelve-ounce container might sit next to an eighteen-ounce tub, each marked with promotional tags, bright clearance stickers, and varied packaging shapes designed to obscure direct comparisons. Evaluating value across different package formats requires reducing those shelf figures to a single common denominator.
- Check the shelf tag for the price per ounce, pound, or quart displayed beside the item total.
- Verify the baseline quotient manually by dividing the retail price by the net package weight.
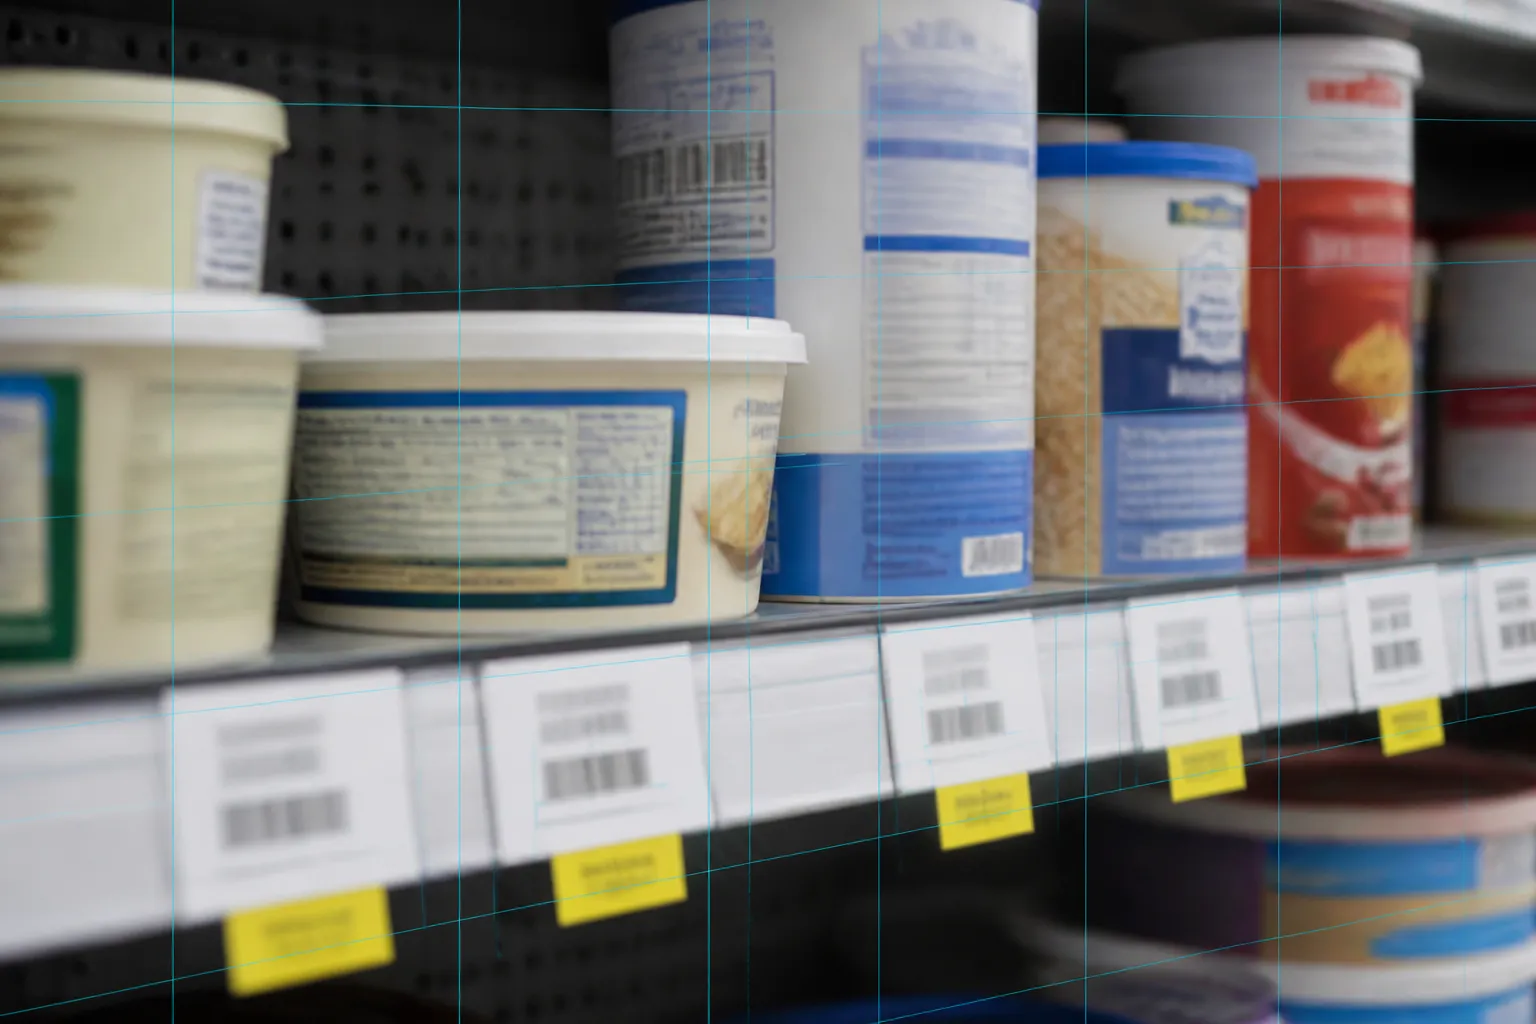
- Compare equivalent product forms across fresh, canned, frozen, and dried inventory.
- Weigh the bulk volume discount against household spoilage rates before committing to larger sizes.
What shelf tags and unit pricing reveal
Unit pricing means pricing goods by a standard unit of measure, such as per ounce, gram, pound, or liter. In grocery retail, shelf tags usually display two separate numbers: the total price you pay at the register and the unit price printed in smaller type. As outlined by the National Institute of Standards and Technology, a clear unit price label shows the product name, pack size, total retail cost, and the cost per standardized unit. Having that standardized rate available allows shoppers to evaluate different container sizes instantly without pulling out a pencil or phone app in every aisle.
Sticker prices can be deceiving because a higher checkout price does not necessarily mean an item is more expensive. A larger package often carries a higher upfront cost while offering a substantially lower cost per unit. Conversely, promotional discounts on smaller containers can occasionally invert that relationship, making two small boxes cheaper per ounce than a single bulk package. Guidance from NDSU Extension highlights that relying on unit pricing helps households avoid assuming that the biggest container is automatically the most economical choice.
How to run the arithmetic on the shelf
When a store tag lacks a printed unit price, or when the measurement unit is inconsistent across competing brands, the underlying math remains straightforward. The basic formula is the total item price divided by the item size. For instance, a jar priced at $2.99 that contains 12 ounces yields a cost of roughly $0.249 per ounce. Running that same division across an alternative brand priced at $3.79 for 16 ounces yields approximately $0.237 per ounce. In this comparison, the higher sticker price represents the better per-unit value by more than a penny per ounce.
Shoppers can also apply this calculation across different sections of the grocery store. Staple pantry items often appear in fresh, frozen, dried, and canned forms. Frozen vegetables or dried beans frequently carry lower unit costs than fresh or canned alternatives, though quality and preparation preferences must factor into the final purchase decision. Price alone cannot determine overall household utility. A bulk gallon of milk or an oversized bag of fresh produce may boast the lowest unit rate in the dairy or produce aisle, but if a family discards one-third of the contents after the expiration date passes, the effective price paid for the consumed portions rises sharply.
Tracking shrinkflation across package changes
Shrinkflation occurs when a manufacturer quietly reduces the volume or net weight of a packaged good while maintaining its previous retail price. A box of crackers that previously weighed 16 ounces might be redesigned to hold 14.5 ounces, while the carton dimensions and price tag remain identical. Because the exterior package changes subtly, shoppers who watch only the retail price rarely notice the cost increase. The unit price serves as a direct indicator of those changes, because dividing the same dollar amount by fewer ounces immediately forces the per-unit number upward.
Monitoring unit costs across recurring purchases offers a practical way to detect these shifts over time. While individual shoppers cannot easily predict when manufacturers alter container molds, recording the baseline unit cost of frequent staples creates a reliable benchmark. If a staple item jumps from $0.18 per ounce to $0.21 per ounce while the sticker price stays unchanged, the household has experienced a real price increase. The Federal Trade Commission offers public educational resources on consumer protection standards, which can help shoppers understand market disclosure rules when product sizes change.
Store brands, coupons, and nutritional value
Evaluating unit prices also clarifies the real savings offered by store brands. Private-label store brands are typically priced lower than their national-brand counterparts on the same shelf. Testing a store brand against an established brand allows a household to evaluate whether the difference in taste or texture justifies the difference in cost per ounce. When manufacturers issue coupons, those discounts can occasionally push a premium brand's unit price below the store-brand equivalent. Performing the division with the coupon deduction applied confirms whether the clipped coupon represents genuine savings or merely matches an existing lower-cost option.
Finally, balancing the unit price against the Nutrition Facts panel ensures that economic choices align with dietary needs. A cheaper box of cereal or pasta sauce may carry a lower cost per ounce because it substitutes inexpensive sugars, oils, or starches for whole grains and produce. Comparing calorie density, protein, sodium, and dietary fiber alongside the cost per unit helps families maintain nutritional standards without overpaying. National datasets compiled by the USDA Economic Research Service and research from the Purdue Center for Commercial Agriculture show that aggregate grocery inflation persists across food-at-home indexes, with specific categories such as beef experiencing significant periodic spikes. In an environment where baseline prices remain elevated, relying on unit-level calculations offers a practical, grounded method to keep household grocery receipts aligned with realistic weekly budgets.


