 Credit Score Education
 Credit Reporting & Consumer Rights
 Personal Finance Tips
 Budgeting & Money Management
 Identity Theft & Fraud Prevention
 Credit Card Education
 Consumer Financial News
 Cost of Living & Inflation
 Banking & Savings Education
 Consumer Protection & Financial Literacy

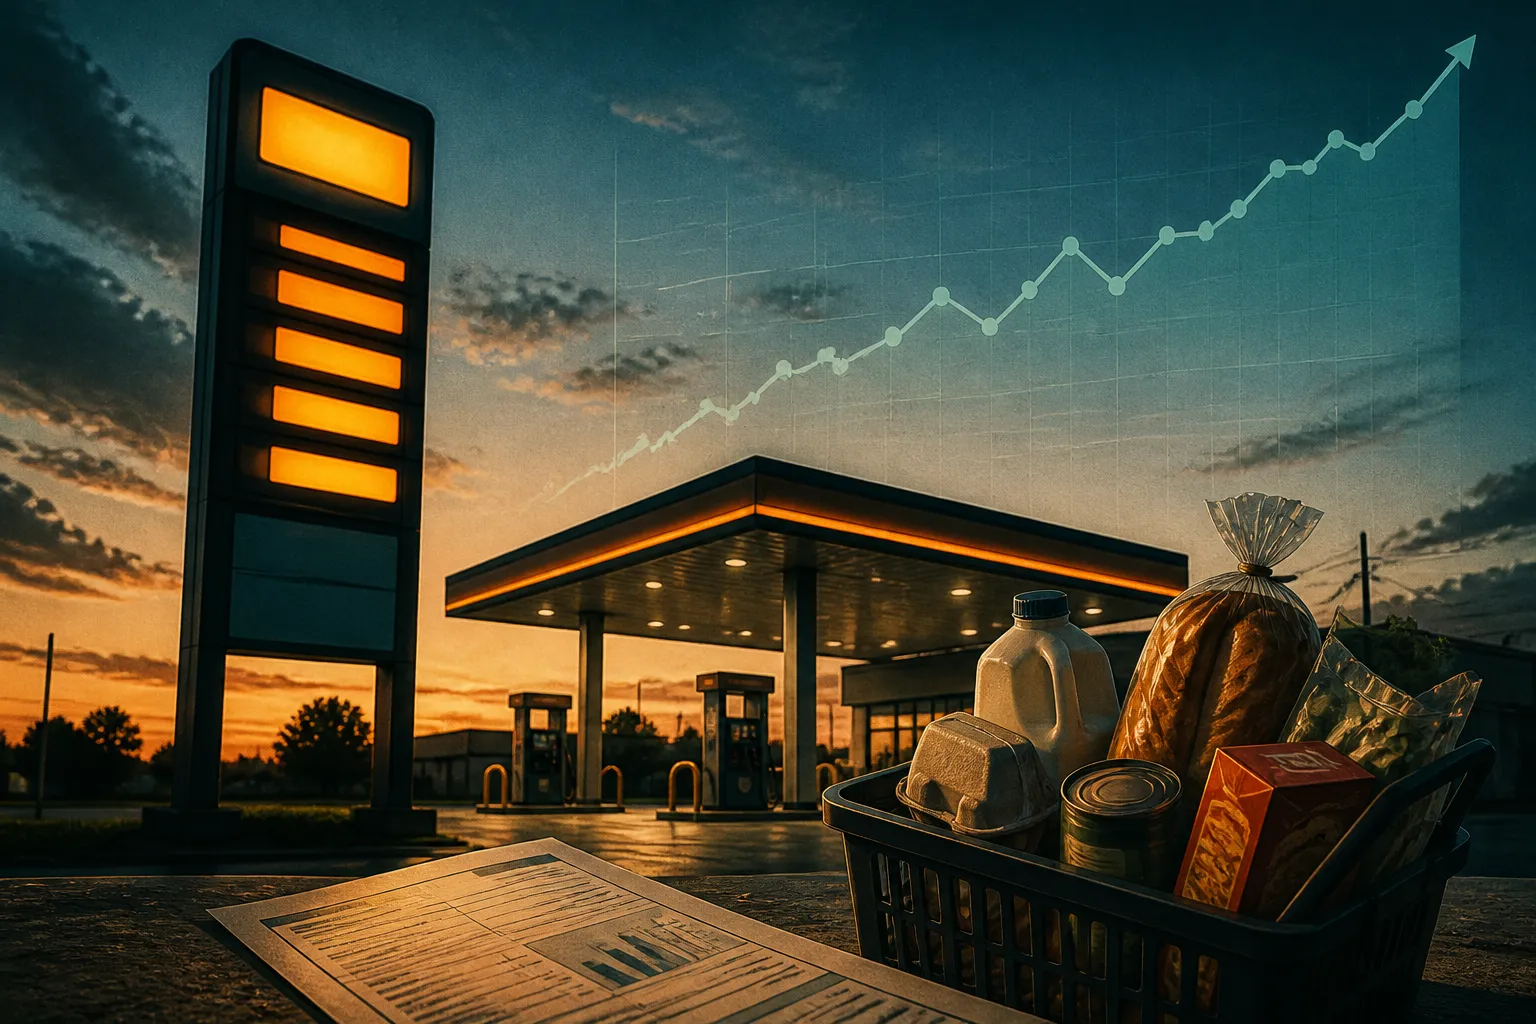
Gasoline is one of the most visible numbers on any street corner, posted on bright signs that change from one morning to the next. Because fuel is a recurring purchase that drivers make weekly or biweekly, sharp shifts at the pump immediately register in household ledgers. Those swings also ripple directly into national inflation data, often dominating the headlines even when other household expenses remain steady.
How the CPI measures prices
Inflation is defined as the change over time in the overall level of prices for goods and services. To track it, federal statistical agencies compare what consumers pay today for a specific set of items against what they paid in earlier periods. The primary benchmark is the Consumer Price Index, produced monthly by the Bureau of Labor Statistics. The headline index, known as the CPI-U, focuses on urban consumers, a group that accounts for approximately 93 percent of the total United States population.
To build this index every month, data collectors price roughly 80,000 separate goods and services. These items are organized into categories and weighted using detailed figures from the Consumer Expenditures Survey. Under this weighting system, goods that claim a larger share of average household outlays exert a heavier pull on the index. As the BLS notes in its educational materials, a percentage increase in chicken prices nudges the index far more than an identical percentage jump in tofu prices, simply because typical grocery spending skews much more toward chicken. Measurement details for utility bills are tracked separately through documents like the agency's factsheet on measuring household energy price change.
Because the CPI calculates changes across an aggregate average basket, the published rate rarely matches the exact line items of any single household. A family with a 45-mile daily highway commute absorbs fuel price changes immediately, whereas an urban commuter using regional transit may notice higher pump prices only indirectly through fare adjustments or delivery fees. That disconnect between aggregate weights and personal receipts often makes the official inflation rate feel detached from individual monthly budgets.
Why oil and gasoline prices swing so much
Crude oil and refined petroleum products are among the most volatile commodities in the global economy. As detailed by the U.S. Energy Information Administration, oil prices respond quickly to supply disruptions caused by geopolitical friction, armed conflict, and extreme weather events. The physical reality of extraction and consumption means that supply and demand are relatively inelastic in the short run. Refineries cannot change output instantly, and motorists rarely park their cars overnight simply because a gallon of fuel rose twenty cents. When a sudden shock hits, prices may have to move sharply to rebalance the market.
The scale of that price move often depends on global buffer capacity. When spare production capacity and commercial inventories are low, any surprise disruption creates an outsized price spike. Because crude oil trades across interconnected international routes, prices in different regions generally track one another closely. A supply stoppage thousands of miles away can alter pump prices across North American metro areas within days.
Historical records show this pattern repeating across several decades. The Arab Oil Embargo of 1973 and 1974, the Iranian revolution and Iran-Iraq war around 1980, and the 1990 Persian Gulf War were all accompanied by political supply bottlenecks and dramatic energy price surges. Recent history shows similar velocity. Retail numbers published by the Federal Reserve Bank of San Francisco note that the average monthly retail gasoline price in the United States reached $4.65 per gallon in May 2026, climbing from $3.06 in February 2026 prior to conflict in the Persian Gulf. Broader context on how measurement rules intersect with public views is documented in BLS guides on common misconceptions about the CPI.
How gas prices can shape inflation expectations
Because retail gas prices are encountered frequently, consumers often use them as a practical proxy for the wider economy. When gas becomes expensive, people frequently assume that everything else is rising at a similar pace. Research published in an Economic Letter from the San Francisco Fed confirms that household expectations about overall inflation tend to move closely with their expectations for gasoline prices.
That link, however, is not symmetrical. Survey data reveals that when households revise their expectations for gas prices upward, their predictions for general inflation climb as well. Yet when gas prices fall, respondents typically make minimal downward revisions to their overall inflation outlook. The study found this upward reaction is especially pronounced among lower-income and less-educated households, with rising gas expectations driving greater uncertainty about future living costs. Even so, the researchers emphasize that the statistical connection remains moderate, and household responses are modest on average. While researchers at the Federal Reserve Bank of Kansas City have also explored how this relationship shifts across different cycles, a spike at the pump does not mean that every sector of the economy is overheating.
Questions to ask when gas prices jump
When pump prices surge over a brief window, consumers and budgeters can step back and evaluate the broader trend through a few practical questions:
- Is the price spike driven by a temporary shock or a structural supply deficit? Temporary refining hiccups or weather interruptions can generate short-term volatility that cools once regular shipping or refinery capacity resumes.
- Are personal expectations about general price growth being distorted by a single visible item? Observing whether non-energy bills like rent, medical services, or groceries are moving at the same pace helps keep overall inflation in perspective.
- How closely does your household driving pattern resemble the federal average? Assessing personal fuel mileage and monthly miles driven can clarify whether energy price shifts pose a minor monthly variation or a major budget strain.
Common mistakes and open questions
A frequent error is assuming that a rapid jump in gasoline prices proves that broad inflation is accelerating across the entire board. Because the relationship identified by researchers is moderate, treating gasoline as a universal gauge can lead households to overstate the pace of price increases in other categories. Another common mistake is assuming that the headline CPI percentage reflects personal expenditures down to the cent, when in truth the index represents a generalized national average, as explained in Brookings analyses on how the government measures inflation.
Several questions remain outside the scope of current retail datasets. Public agency summaries do not fully reveal how fast alternate energy components adjust in the CPI, or the precise degree to which natural gas and grid electricity rates lag crude oil swings. The mechanisms behind retail refining margins, outlined broadly on the EIA's resource detailing factors affecting gasoline prices, also vary significantly by state tax rules and regional distribution networks. Consumers looking to track systemic price changes can consult resources from the Bureau of Labor Statistics, the Energy Information Administration, or consumer protection agencies like the CFPB and FTC to review verified cost trends.


