 Credit Score Education
 Credit Reporting & Consumer Rights
 Personal Finance Tips
 Budgeting & Money Management
 Identity Theft & Fraud Prevention
 Credit Card Education
 Consumer Financial News
 Cost of Living & Inflation
 Banking & Savings Education
 Consumer Protection & Financial Literacy

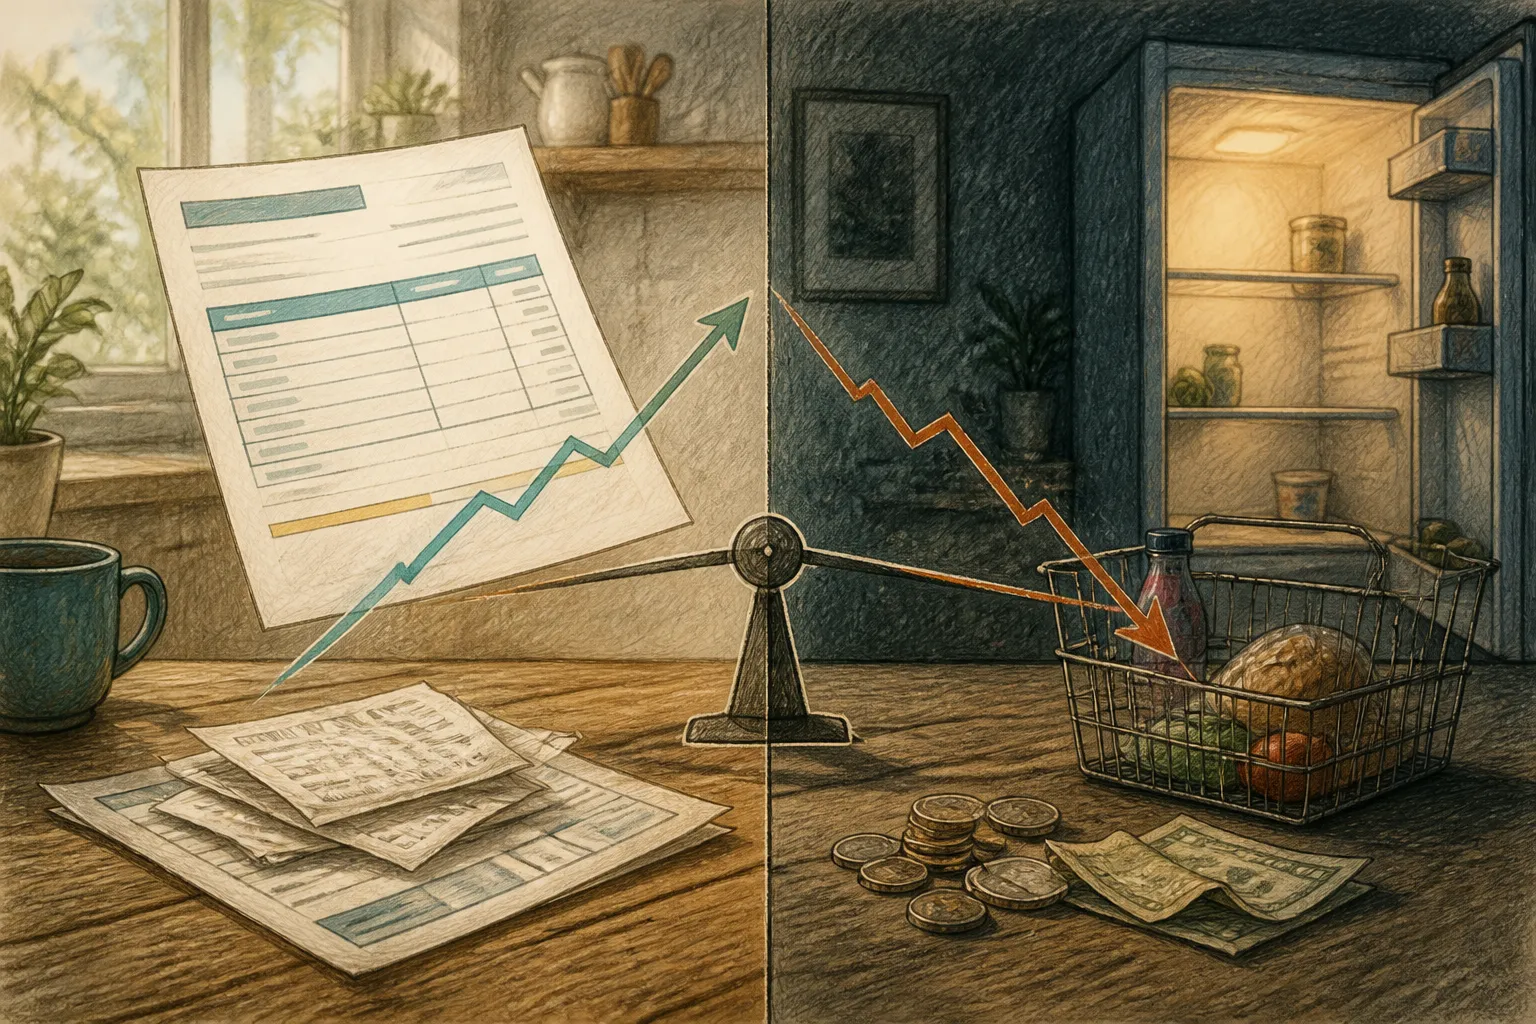
A bump in gross pay on a paycheck stub looks like progress, but grocery register receipts and monthly utility statements often tell a quieter story. Inflation means prices rise across the economy over time, which means each single dollar buys less food, fuel, and shelter than it did in previous years. A salary that appears higher on paper can easily buy fewer goods than a smaller paycheck bought several years earlier.

The central question for any household budget is not simply whether earnings went up, but whether earnings grew by more than the cost of daily life. When someone compares their 2021 wages directly to their current earnings without accounting for price shifts, they treat two very different dollars as equal units. That optical illusion can obscure a quiet decline in purchasing power.
To find out what happened to your real standard of living, you must restate your older salary in today's dollars. Once the older figure reflects modern purchasing power, you can place it next to what you earn now. At that point, the arithmetic reveals whether your real compensation expanded, held steady, or lost ground.
Public data published by the federal government makes this comparison possible on a standard desk notepad. By using benchmark numbers from the Federal Reserve Bank of Minneapolis, you can trace how price adjustments affect your own balance sheet.
Why a raw salary comparison misleads
Nominal wages represent the raw number printed on your direct deposit notice or W-2 form. Real wages, by contrast, measure what those numbers can actually purchase at the counter. When inflation accelerates, nominal earnings can climb steadily while real purchasing power quietly slips backward.
Consider an employee whose salary shifted from $50,000 in 2021 to $55,000 in 2025. On paper, that change looks like a $5,000 gain, or a 10 percent pay bump. However, the costs of eggs, auto insurance, and apartment rent did not stay still during that same window. If prices overall jumped by 18 or 19 percent across those years, the employee needs roughly $59,000 just to maintain their initial standard of living.
Directly comparing past pay to present pay misses this underlying drift in value. To answer the question accurately, you have to bring the past number forward into current purchasing terms before drawing any conclusion.
Using the annual average CPI table
The Consumer Price Index for All Urban Consumers, known as the CPI-U, is the benchmark most commonly used to measure price changes in the United States. The Federal Reserve Bank of Minneapolis hosts a reference table of annual average CPI-U values spanning from 1913 to the present day, using a standard base period where the years 1982 to 1984 equal 100.
Converting past pay into current dollars relies on a straightforward formula:
Year 2 Pay = Year 1 Pay × (Year 2 CPI ÷ Year 1 CPI)
In this equation, Year 1 is the year your previous salary was established, and Year 2 is the comparison year. The annual average figures recorded in the Minneapolis Fed table outline the recent path of consumer prices:
- 2020: 258.8
- 2021: 271.0 (an annual change of 4.7 percent)
- 2022: 292.7 (an annual change of 8.0 percent)
- 2023: 304.7 (an annual change of 4.1 percent)
- 2024: 313.7 (an annual change of 2.9 percent)
- 2025: 321.9 (an annual change of 2.6 percent)
Suppose you earned $50,000 in 2021 and want to find the equivalent purchasing power for 2025. You take $50,000, multiply it by the 2025 CPI value of 321.9, and divide that product by the 2021 CPI value of 271.0. The arithmetic yields approximately $59,391. In some reference summaries, an adjusted figure of $59,380 appears due to differing intermediate decimal rounding, which is why working through the steps directly on paper helps you track the exact figures. If your 2025 salary was equal to or higher than that restated amount, your pay kept pace with consumer price changes over that specific four-year span.
Handling provisional figures and index limits
While annual average tables provide a clean overview, they come with technical boundaries that affect how you interpret the output. The Minneapolis Fed notes that current-year numbers often incorporate the most recent quarterly data available. As a result, the latest annual figure in any index table may remain provisional until official agencies finalize full-year surveys. Anyone running numbers for a recent period should treat the result as an estimate and verify the calculation once finalized annual summaries are published.
Historical comparisons also require care. The Minneapolis Fed notes that its table relies on the CPI-U series from 1978 forward, whereas figures before 1978 draw on an earlier price measure. If you are examining earnings from several decades ago, you need to check which series your data source relies on.
For those who prefer not to run manual division, public research tools can simplify the process. For example, USAFacts maintains a monthly inflation tool powered by data from the Bureau of Labor Statistics that dates back to 1913. These digital tools help cross-check your math, while the manual table calculation shows every underlying step clearly.
Questions to ask before you trust a result
A mathematical result is only as dependable as the assumptions behind it. Before relying on an inflation adjustment to evaluate your household balance sheet, consider several practical questions:
- Which index series was used? Confirm whether the data source relies on the CPI-U or another metric, and ensure that the time window matches your specific employment dates.
- Is the endpoint figure finalized? Check whether the most recent year in the comparison uses provisional or quarterly averages that might be revised later by the Bureau of Labor Statistics.
- Does the figure reflect total compensation? Inflation formulas adjust gross wages, but they do not account for shifts in payroll deductions, health insurance premiums, employer retirement contributions, or changes in weekly hours worked. A gross wage might keep up with prices while take-home pay shrinks due to rising benefit costs.
Common pitfalls and practical limits
One frequent mistake is evaluating wage growth by looking solely at percentage raises without consulting price shifts. A 3 percent raise feels positive on its own, but in a year when prices rise by 4 percent or more, that adjustment represents a quiet decrease in what your paycheck can buy.
Another common misstep involves taking a single snapshot across several years while ignoring intermediate adjustments. If you received irregular pay adjustments between 2021 and 2025, a simple two-point comparison will show your net position today, but it will not show how your purchasing power fluctuated during the high-inflation period of 2022. Public source tables provide year-by-year averages, but they do not automatically chart personal compensation histories that include bonuses or changes in title.
This guide serves an educational purpose and does not constitute personal financial, tax, or legal advice. Real-world financial stability involves tax obligations, local living costs, and debt obligations that sit outside standard index tables. For authoritative information on consumer price data and wage trends, review research materials from the Federal Reserve Bank of St. Louis, the Bureau of Labor Statistics, or educational guidance from federal consumer protection agencies such as the Consumer Financial Protection Bureau.


